IV. EFFECTS OF CRYOPRESERVATION ON THE HISTOLOGY OF SELECTED TISSUES (Liver and Kidneys)
Histology was evaluated in two animals each from the FIG and FIGP groups, and in one control animal. Only brain histology was evaluated in the straight-frozen control animal.
Liver
The histological appearance of the liver in all three groups of animals was one of profound injury. Even in the FGP group, the cellular integrity of the liver appeared grossly disrupted. In liver tissue prepared using Yajima stain, the sinusoids and spaces of Disse were filled with flocculent debris, and it was often difficult or impossible to discern cell membranes (Figures 30-32). The collagenous supporting structures of the bile canaliculi were in evidence and the nuclei of the hepatocytes appeared to have survived with few alterations evident at the light level, although frequent pyknotic nuclei were noted in the FIGP group (Figures 31 & 34). Indeed, the nuclei often appeared to be floating in a sea of amorphous material (Figure 34). Not surprisingly, the density of staining of the cytoplasmic material was noticeably reduced over that of the fixative-perfused control. Few intact capillaries were noted.
FGP liver tissue prepared with PAS stain exhibited a similar degree of disruption (Figure 32). However, quite remarkably, the borders of the hepatocytes were defined by a clear margin between glycogen granule containing cytoplasm and non-glycogen containing membrane or other material (membrane debris?) which failed to stain with Yajima due to gross physical disruption, or altered tissue chemistry (Figure 35).

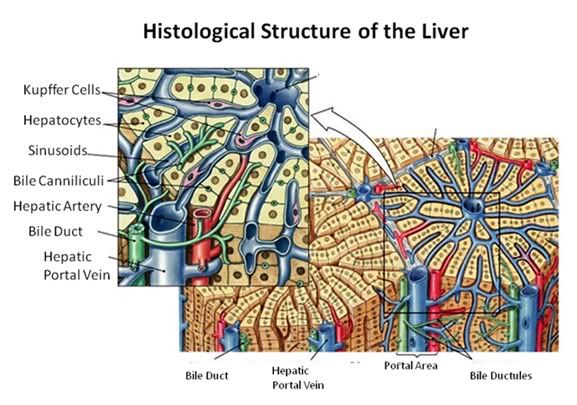
Figure 27: The fundamental histological structural unit of the liver is the liver lobule, a six-sided prism of tissue ~ 2 mm long and ~1 mm in diameter. The lobule is defined by interlobular connective tissue which is not very visible under light microscopy in the cat (or in man). In the corners of the lobular prisms are the portal triads. In tissue cross sections prepared for microscopy, the lobule is filled by cords of hepatic parenchymal cells, the hepatocytes, which radiate from the central vein and are separated by vascular sinusoids. The bulk of the liver consists of epithelial hepatocytes arranged into cords, separated by the vascular sinusoids through which the portal blood percolates. The epithelium of the sinusoids is decorated with phagocytic Kuppfer cells that are the primary mechanism for removing gut bacteria present in the venous splanchnic circulation.
The cords of hepatocytes comprise the hepatic parenchyma. In section, the hepatic cords appear as linear ropes (or cords) of hepatocytes. Viewed 3-dimensionaly, the cords consist of intricately folded branching and connected planes of cells which extend parallel to the long axis of the lobule and radiate out from the its center. The hepatocytes in each cord are attached to each other wherever they come into contact, as well as to the sinusoids at either end of the lobular pyramid. The sinusoids are vascular spaces lined by fenestrated endothelium that has no basement membrane, thus allowing the plasma to pass over the large surface area sheets of hepatocytes for detoxification. The sinusoid endothelium stands off from the underlying hepatocytes allowing space for the plasma to interact with the hepatocytes and Kupffer cells (the space of Disse).
Bile canaliculi, formed by apical surfaces of adjacent hepatocytes, form a network of tiny passages contained within each hepatic cord.
 Figure 28: Control-1 Liver, Yajima, 100x. Liver sections from the Control animal demonstrated normal morphology as can be seen in the image above.

Figure 29: Control-1 Liver, PAS, 100x. Liver sections were prepared with both Yajima and PAS stain in order to allow visualization of structures that neither stain discloses alone; in this case, most importantly, the presence or glycogen granules in the hepatocytes of the Control animal. Note the presence of normal intralobular architecture with crisp cell membranes in evidence, normal appearing sinusoid spaces, and residual sinusoidal red blood cells (RBCs) not washed out during fixative perfusion.
 Figure 30: FGP-1 Liver, Yajima, 100x. The livers of FGP animals demonstrated extensive histological disruption. The sinusoids were all but obliterated and appeared filled with debris (ds) and the cytoplasm was extensively vacuolated (v).
 Figure 31: FIG-2 Liver, Yajima, 100x. As was the case with the FGP animals, the sinusoids were barely discernable and appeared filled with cellular debris (cd). In addition to extensive cytoplasmic (cv) and nuclear vacuolization (nv), pyknotic nuclei (pn) were also present. Cell membranes were difficult to discern and in many areas, frank cell lysis appears to have occurred with flocculent cellular debris (cd) appearing to fill the sinusoids.
 Figure 32: FGP-1, Liver, PAS, 100x. The intensely red-stained granules present in the cytoplasm of the hepatocytes are glycogen deposits selectively stained by PAS. There is extensive cytoplasmic (cv) and nuclear vacuolization (nv) and the sinusoids appear filled with flocculent cellular debris (d). Indeed, it is only possible to discern the outlines of the original individual hepatocytes from the pattern of the intracellular glycogen granules disclosed by the PAS stain.

Figure 33: FIG-2, Liver, Yajima, 100x, well preserved area. While the bulk of the hepatic parenchyma exhibited the severe injury seen in Figures 30-32, there were frequently observed islands of comparatively well preserved tissue visible in both the FGP and FIGP sections suggesting that freezing injury is occurring non-homogenously.

Figure 34: FIG-2, Liver, PAS, 100x, necrotic area. There were patchy areas of frank necrosis visible in the livers of the FIGP animals that were not present in the livers of the FGP animals. This area, adjacent to a central vein, shows extensive cell lysis with heavy vacuolization of the cytoplasm (v) and many pyknotic nuclei (pn) in evidence.

Figure 35: FIG-2, Liver, PAS, 100x. Note the presence of a few scattered glycogen granules (GG). Interestingly, in this comparatively well preserved area of FIGP liver it is possible to see some remaining deposits of glycogen that were not consumed during the long post-arrest ischemic interval. The absence of pyknotic nuclei and the relative absence of large intracellular vacuoles is also remarkable.
Kidney

Figure 36: The functional unit of the kidney is the nephron, consisting of the glomerulus and the uriniferous tubule ( the renal corpuscle: a).The capillary tuft of the nephron, the glomerulus, is enclosed within a double cell layered structure; Bowman’s capsule. Bowman’s capsule and the capillary tuft it encloses comprise the glomerulus. Bowman’s capsule and the glomerular capillary tuft constitute the renal (or Malpighian) corpuscle (b).
Bowman’s capsule opens into the proximal convoluted tubule which leads to the loop of Henle. The loop of Henle leads to the distal convoluted tubule which then leads to the collecting duct.
The inner layer of Bowman’s capsule is the visceral layer. It consists of cells called podocytes. The outer layer of Bowman’s capsule is the parietal layer. The pedicels are the foot processes on the podocytes.
The juxtaglomerular cells secrete renin which is ultimately metabolized into angiotensin II, a potent vasoconstrictor critical to maintaining normotension. The macula densa are specialized cells in the distal convoluted tubule that are responsible for sodium, and thus fluid regulation. The juxtaglomerular cells and macula densa make up the juxtaglomerular apparatus.
PAS stain was used to prepare the control, FGP and FIGP renal tissue for light microscopy. The histological appearance of FGP renal tissue was surprisingly good (Figures 329, 40 & 41). The glomeruli and tubules appeared grossly intact and stain uptake was normal. However, a number of alterations from the appearance of the control were apparent. The capillary tuft of the glomeruli appeared swollen and the normal space between the capillary tuft and Bowman’s capsule was absent. There was also marked interstitial edema, and marked cellular edema as evidenced by the obliteration of the tubule lumen by cellular edema.
By contrast, the renal cortex of the FIGP animals, when compared to either the control or the FGP group, showed a profound loss of detail, absent intercellular space, and altered staining (Figures 40 & 42). The tissue appeared frankly necrotic, with numerous pyknotic nuclei and numerous large vacuoles which peppered the cells. One striking difference between FGP and FIGP renal cortex was that the capillaries, which were largely obliterated in the FGP animals, were consistently spared in the FIGP animals. Indeed, the only extracellular space in evidence in this preparation was the narrowed lumen of the capillaries, grossly reduced in size apparently as a consequence of cellular edema.
Both ischemic and non-ischemic sections showed occasional evidence of fracturing, with fractures crossing and severing tubule cells and glomeruli (Figure 41).

Figure 37: Control, Renal Cortex, PAS 40x. Three glumeruli are present (G) adjacent to crisp, well defined proximal (P) and distal (D) convoluted tubules. The intertubular capillaries (C) show normal diameter with lumens free of red cells or debris. There is normal capsular space between Bowman’s capsule (BC, yellow arrows) and the glomerular capillary tuft and vascular pole (VP) are also normal in appearance.

Figure 38: Control-1, PAS 40x. Collecting ducts (CD), distal tubules (D) and a glomerulus (G) are present in 6this micrograph of renal apical column. At right, a glomerulus is present with normal Bowman’s space (BS) and the macula densa (MD) in evidence.

Figure 39: FGP-1, Renal Cortex, PAS, 40x. The intertubular space (ITS) is great expanded and the tubule cells are heavily vacoulated (V) and lack definition. The intratubular space (IS) is no longer in evidence and the architecture of the glomerluar capillary tuft (GT) is radically altered and there is an absence of the normal architecture of Bowman’s space (yellow arrows). The intertubular capillaries appear to have been reduced to debris (D) visible in the intertubular spaces.

Figure 40: FIG-2 Renal Cortex, PAS, 40x. There is massive cellular edema present with almost complete obliteration of Bowman’s space. The tubule (T) lumens are no longer visible and the tubule cells are extensively vacoulated with many pyknotic nuceli in evidence. Individual tubular cell membranes are impossible to resolve. The afferent glomerular arteriole (AA) appears intact (red arrow).

Figure 41: FIG-2 Renal Cortex, fracture present (arrows), PAS, 40x. Two renal tubules, possibly a proximal and distal convoluted tubule (T) are dissected by a fracture as is the macula densa (MD) of the glomerulus (G). Remarkably, there is still a small amount of intertubular space present in this micrograph.

Figure 42: FIG-2 Renal Cortex, PAS 40x. vacuolization (black arrows) and extensive vacuolization (blue arrows) accompanied by necrotic changes, such as the frequent presence of pyknotic nuclei (red arrows).
END OF PART 2